On Friday, MedPAC released its July 2016 data book. The data book is an annual MedPAC publication filled with charts and tables presenting much of the information from our March report, plus more, in a convenient and accessible reference guide. In this post, we’re highlighting two charts (5-7 and 5-8) about low-value care that can be found in this year’s edition.
Low-value care is the provision of a service that has little or no clinical benefit, or when the risk of harm from the service outweighs its potential benefit. In addition to increasing health care spending, low-value care may harm patients by exposing them to the risks of injury from inappropriate tests or procedures, and may lead to a cascade of additional services that contain risks but provide little or no benefit.
A team of researchers has developed measures of low-value care drawn from evidence-based lists such as the Choosing Wisely campaign, an initiative of the American Board of Internal Medicine Foundation, and the medical literature. They then applied these measures to Medicare claims data. Last year, MedPAC contracted with these researchers to obtain their measures, and applied them to 2012 Medicare claims data. The amount of low-value care was substantial – between 28 and 65 low-value services per 100 beneficiaries, for a total of between $1.9 and $5.8 billion in Medicare spending, depending on whether narrow or broad versions of the measures were used. Broader versions capture more potentially inappropriate use, but also are more likely to count some appropriate use as inappropriate. Narrower versions are less likely to count appropriate use as inappropriate, at the expense of potentially missing some instances of inappropriate use.
In this year’s data book, we update our analysis of these claims-based measures of low-value care using a new year of data (2013) and add five new measures developed by the original researchers, for a total of 31 measures. Depending on whether the measure definitions are broad or narrow, there were between 35 and 74 low-value services per 100 beneficiaries in 2013 and between 23 percent and 38 percent of beneficiaries received at least one low-value service. Medicare spending for low-value services ranged from $2.6 billion to $7.1 billion in 2013. The differences between the broader and narrower versions shows that the amount of low-value care detected varies substantially based on the measures’ clinical specificity.
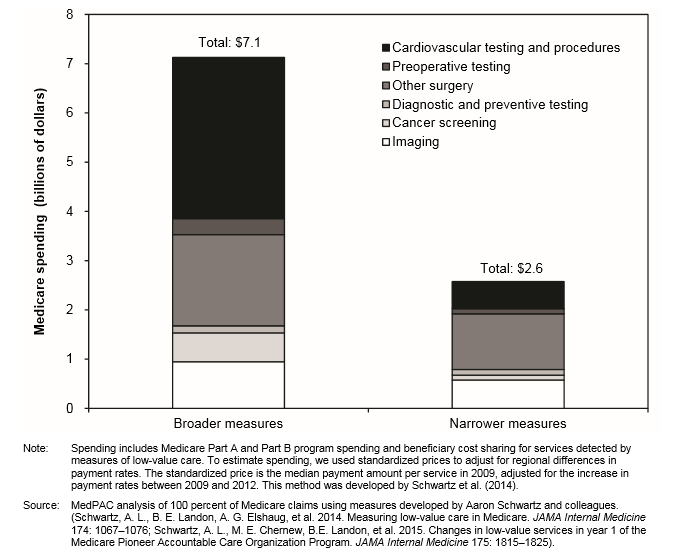
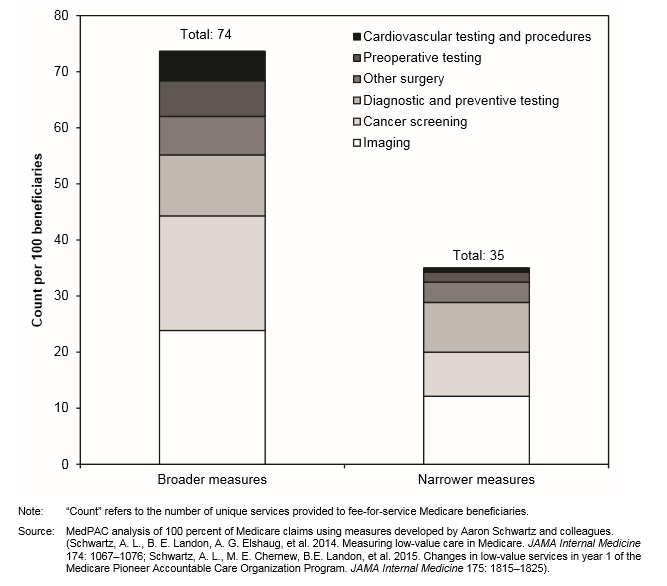
After grouping the 31 measures into six larger clinical categories, we found that imaging (e.g. imaging for lower back pain) and cancer screening measures (e.g. colon cancer screening for older adults) accounted for 60 percent of the volume of low-value care per 100 beneficiaries among the broader versions of the measures (Chart 5-7). However, cardiovascular testing and procedures (e.g. stent placement for stable coronary disease) and other surgical procedures (e.g. vertebroplasty for osteoporotic vertebral fractures) comprised over 70 percent of the spending (Chart 5-8). Among the narrower versions of the measures, imaging and diagnostic and preventive testing accounted for 60 percent of the volume of low-value care, while other surgical procedures and imaging comprised two-thirds of the spending (Charts 5-7 and 5-8).
An important caveat is that this analysis most likely represents a very conservative estimate of the amount of low-value care in Medicare. Applying measures to Medicare claims data makes use of data available to the Commission, and allows us to include most FFS Medicare beneficiaries. However, it is difficult to measure low-value care through claims data alone, without detailed clinical information, and it may not be possible to measure all types of low-value care with this method. In addition, our spending estimates probably understate actual spending on low-value care because they don’t include downstream services (e.g. follow-up tests and procedures) that may result from the initial low-value service.
Data book chart 5-7: use of services detected by selected measures of low-value care, 2013
Data book chart 5-8: Spending on services detected by selected measures of low-value care, 2013