In Medicare, the prices paid to providers are set by law. In contrast, commercial insurers usually negotiate prices with providers. As we discuss below, prices negotiated by commercial insurers vary wildly across providers and insurers, and prices have grown faster for providers with more market power.
On average, since 2007 commercial prices have grown faster than Medicare’s prices (Health Care Cost Institute 2016, Medicare Payment Advisory Commission 2017). The faster growth in provider prices has contributed to health maintenance organization (HMO) premiums growing by 53 percent and preferred provider organization (PPO) premiums by 47 percent from 2007 to 2016 (see figure below).
To compare employer-sponsored plans’ premium growth with Medicare cost growth, we examined per capita spending for beneficiaries with FFS Medicare including per capita spending on Part A, Part B and Part D. Over the same period, combined Medicare per capita costs grew by 23 percent (see the figure below). If FFS Medicare had followed growth in commercial pricing, then Medicare costs would have grown substantially more.
Cost of employer-sponsored commercial insurance has grown twice as fast as Medicare costs
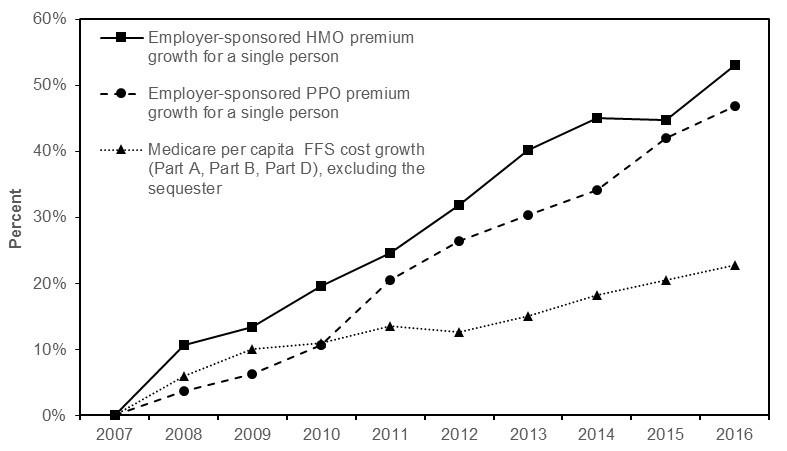
Note: HMO (health maintenance organization), PPO (preferred provider organization), FFS (fee-for-service). Medicare spending is reported prior to the sequester which reduced program spending by 2 percent. After the effect of the sequester, Medicare spending grew by 21 percent from 2007 to 2016.
Source: Employer-sponsored premium data are from Kaiser Family Foundation surveys, 2007 through 2016. Medicare spending figures are from Part A and Part B program spending data from the CMS actuaries; Part D spending per capita figures through 2015 are from MedPAC analysis of claims and reinsurance data for individuals with Part D coverage. Part D spending for 2016 is a projection.
The Commission discussed the effect of provider consolidation on private prices and the pressure that creates for Medicare to increase FFS prices at two Commission meetings over the past year. The Commission’s findings were presented in MedPAC’s June report to Congress. The key findings were:
Markets with greater physician-practice consolidation have had greater increases in physician prices.
Commercial insurers pay small independent physician practices at rates similar to Medicare for standard office visits. However, physicians in large practices and hospital-affiliated practices (who have stronger market power) receive higher rates from insurers.
Commercial insurers also pay higher rates to hospitals with greater market power. Gaynor, Ho, and Town report that “Mergers between rival hospitals are likely to raise the price of inpatient care and these effects are larger in concentrated markets. The estimated magnitudes are heterogeneous and differ across market settings, hospitals, and insurers” (Gaynor et al. 2014).
Commercial prices vary widely by individual hospital and individual insurer. On average, commercial prices are about 50 percent higher than average hospital costs and are often far more than 50 percent above Medicare prices (Cooper et al. 2015, Health Care Cost Institute 2014, Medicare Payment Advisory Commission 2014, Selden et al. 2015).
The Commission is concerned that these market concentration effects will lead to higher Medicare spending if commercial prices are “imported” into Medicare. The Commission has tried to counteract these effects by recommending restrained payment updates and by recommending site neutral payments (paying the same for a service regardless of the setting of care). Medicare beneficiaries have robust access to hospital and physician services in most markets. And with respect to hospital services, given the low occupancy rates and the marginal profits of taking a Medicare patient, access to care is unlikely to be threatened in the near-term (Medicare Payment Advisory Commission 2017). However, if commercial prices continue to grow faster than Medicare prices, some providers may stop participating in Medicare, and the Commission will continue to monitor Medicare beneficiaries’ access to health care.
References
Cooper, Z., S. V. Craig, M. Gaynor, et al. 2015. That price ain’t right? Hospital prices and health spending on the privately insured. NBER working paper no. 21815. Cambridge, MA: National Bureau of Economic Research.
Gaynor, M., K. Ho, and R. Town. 2014. The industrial organization of health care markets. NBER working paper no. 19800. Cambridge, MA: National Bureau of Economic Research.
Health Care Cost Institute. 2014. 2013 health care cost and utilization report. Washington, DC: HCCI.
Health Care Cost Institute. 2016. 2015 health care cost and utilization report. Washington, DC: HCCI.
Medicare Payment Advisory Commission. 2014. A data book: Health care spending and the Medicare program. Washington, DC: MedPAC.
Medicare Payment Advisory Commission. 2017. Report to the Congress: Medicare payment policy. Washington, DC: MedPAC.
Selden, T. M., Z. Karaca, P. Keenan, et al. 2015. The growing difference between public and private payment rates for inpatient hospital care. Health Affairs 34, no. 12 (December 1): 2147-2150.