The number of beneficiaries with Medigap policies has been growing, both in absolute terms, and as a share of beneficiaries in fee-for-service (FFS) Medicare. At the same time, a greater share of those with Medigap have chosen Medigap policies that include some significant amount of beneficiary liability for cost sharing. This blog post examines these trends using annual Medigap policy sales data from the National Association of Insurance Commissioners (NAIC) covering the years 2010 to 2015.
In 2010, there were approximately 36 million FFS Medicare beneficiaries (beneficiaries not enrolled in capitated Medicare managed care plans). The NAIC reports about 9.7 million Medigap policies were sold in 2010. For the purposes of this post, we will treat the policies sold as roughly equivalent to the number of beneficiaries covered by Medigap.[1] This means that in 2010 about 27 percent of beneficiaries in FFS Medicare had Medigap coverage to offset some or all of their Medicare cost sharing. By 2015, the number of beneficiaries in FFS Medicare grew to 38.2 million, and the number of beneficiaries with Medigap increased to 11.8 million. So in 2015, about 31 percent of beneficiaries in FFS Medicare had Medigap coverage (See Table 1).
The following analysis reports on enrollment trends in Medigap plans by different levels of cost sharing. It focuses on enrollment in standard plans. The share of Medigap enrollment in standard plans has increased slightly over time, from about 87% in 2010 to about 91% in 2015 (not shown in table). Beneficiaries who had enrolled in some non-standard benefit packages that were sold before 1990 and some standard packages that are no longer sold can continue to buy those packages. The number of these policies has declined from 1.3 million in 2010 to 1.0 million in 2015, as there is high mortality in the pre-standard policies that have been kept for a minimum of 25 years. Additionally, there are three states (Massachusetts, Minnesota and Wisconsin) that have exemptions from the national standards that set cost sharing for policies. Enrollment in all of those non-standard plans is not included in the following analysis.
Current Medigap plans have 11 different standard benefit packages. Of the 11 standard packages, two (Plan C and Plan F) cover virtually all Medicare cost sharing (i.e., first-dollar coverage). In addition, a discontinued plan (Plan J) covers all Medicare cost sharing. The market share of policies requiring no cost sharing has declined steadily. If we group the enrollment of these three plans, we find that in 2010, 77 percent of Medigap beneficiaries with standard policies (both current and discontinued), had virtually all of their cost sharing for FFS Medicare covered by Medigap. By 2015, the share of Medigap beneficiaries with one of these policies had declined to 72 percent.
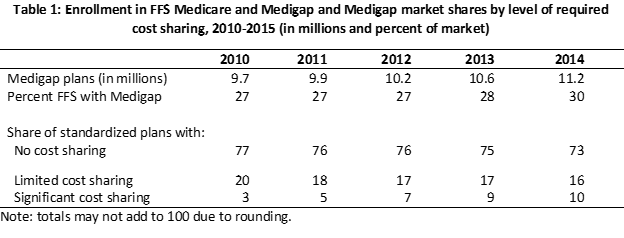
The market share of the standard policies that require limited cost sharing (Plans A, B, D, E, G, H, I and M) are on the next line of Table 1. These policies do not cover the Part A and or the Part B deductible and some do not cover the cost sharing for days 21 through 100 of a skilled nursing facility stay. Outside of the deductible, all of the policies we have classified as limited cost sharing plans cover all beneficiary cost sharing for Part B services. If we group the enrollment of these eight plans, we find that in 2010, 1.6 million beneficiaries, or 20 percent of Medigap beneficiaries with standard policies, had the majority of their cost sharing for FFS Medicare covered by Medigap. The market share of these policies also has declined steadily and in 2015, 16 percent of standard policies sold require limited Medicare cost sharing.
The remaining standard policies (Plans K, L, N, and the high deductible Plan F) can require significant cost sharing. The policies we have classified as significant cost sharing do not cover all beneficiary cost sharing on Part B spending. As a percentage of standard plans, these policies, shown on the next line in Table 1 rose from 3 percent in 2010 to 12 percent in 2015. The bulk of the enrollment is in Plan N which was introduced in 2010. Enrollment in Plan N grew by an average annual rate of 45 percent over the 2010-2015 period, with enrollment in 2015 reaching almost one million beneficiaries. While the Part B deductible is not covered under several standard policies, Plan N is unique in that required Part B cost sharing includes a fixed amount ($20) per physician visit and emergency room visit ($50). The majority of the remaining policy-holders in the group with significant cost sharing are in the high-deductible Plan F, which covers all Medicare cost sharing after the deductible of $2,180 (in 2016). The number of high-deductible Plan F policies grew by an average annual rate of 10 percent over the 2010-2015 period.
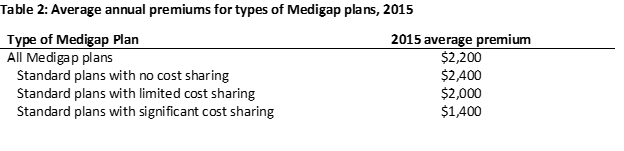
The data suggest that beneficiaries are willing to enroll in plans with significant cost sharing if they can save on premiums. The average premium for the policies that have no cost sharing was about $2,400 per year in 2015 (Table 2). The average annual premium for the policies with significant cost sharing was about $1,400. In addition to premium savings, while Plan N and the high-deductible Plan F require significant cost sharing, they do not require unlimited cost sharing. Cost sharing under the high-deductible version of Plan F is limited to $2,180 in 2016. While there is no set limit on cost sharing under Plan N, after the Part B deductible ($166 in 2016) is satisfied, the policy-holder is only responsible for copayments of $20 for physician office visits and $50 for emergency room visits that do not result in a hospital admission[2]. We might expect to see more growth in the plans with significant cost sharing. Due to a provision in the Medicare Access and CHIP Reauthorization Act (MACRA), beginning in 2020 insurers will not be able to sell policies with first-dollar coverage, although beneficiaries who already have such policies can renew them.
[1] There are reasons why the NAIC data may overstate the number of covered beneficiaries at a point in time and reasons why the data may understate the number of covered beneficiaries. The overstatement occurs because the NAIC data includes all sales, including to beneficiaries who did not have a policy for the entire year because they died or dropped coverage during the year or because they first purchased coverage in the middle of the year. The understatement occurs because there are a small number of plans that do not report to the NAIC.
[2] There is no cost sharing for physician office visits focused on preventative service e.g., an annual wellness visit.