In the 21st Century Cures Act of 2016, Congress mandated that MedPAC examine the effects of Medicare’s Hospital Readmissions Reduction Program (HRRP). Created by Congress in 2010, the HRRP penalizes hospitals with high rates of readmission for a selected set of conditions (pneumonia, acute myocardial infarction (AMI), heart failure, hip and knee replacement, chronic obstructive pulmonary disease (COPD), and recently expanded to include coronary artery bypass grafts). In response to the Congressional mandate, MedPAC assessed the effects of the HRRP through 2016 in its June 2018 report to the Congress.
In the course of updating this work to include 2017 readmission rates, we discovered an error in our calculations that resulted in an understatement of 2016 readmission rates. Originally, we reported raw (not risk adjusted) all-condition unplanned readmission rates declined from 16.7 percent in 2010 to 15.0 percent in 2016. However, these rates were understated because we did not include readmissions that occurred after the end of fiscal year 2016. After correcting for this error we found that the true rate of readmissions declined from 16.7 percent to 15.6 percent. The error affecting readmission in 2016 did not affect any of the mortality computations or readmission rates prior to 2016, and our conclusion remains that the HRRP has been successful in reducing readmissions, without causing an adverse effect on beneficiary mortality.
As discussed below, our updated and corrected readmissions analysis has the following key findings:
- Raw (i.e., not risk-adjusted) readmission rates declined from 2010 when the HRRP was passed to 2014. But since 2014 raw readmission rates have been relatively stable.
- On a risk-adjusted basis, however, readmission rates continued to decline after 2014. Some of this decline appears to be real, and some appears to be attributable to hospitals’ coding practices.
- Raw mortality rates for some conditions (e.g., pneumonia, AMI) were improving prior and continued to improve after enactment of the HRRP. However, heart failure mortality was increasing prior to enactment and raw mortality rates continued to increase up to 2013. Causing some concern. However, risk-adjusted mortality declined across all conditions from 2010 through 2017, with some of the risk-adjusted mortality decline reflecting coding changes and some of the change reflecting a real improvement in mortality.
The difference between raw rates and risk-adjusted rates reflects hospitals reporting that inpatients had a higher number of comorbidities in later years. We believe some of the increase in reported severity of illness was due to more complete coding of patient diagnoses. This in part may reflect the 2011 expansion in the number of secondary diagnosis codes that hospitals could report on inpatient claims from 9 to 24 in 2011 (Ody et al. 2019, Sukul et al. 2019).
While some of the increased severity of illness may have been due to coding changes, we believe that there was also some real increase in severity of illness over the period. An increase in severity of illness is consistent with two types of data that do not depend on coding conventions. First, the rate of initial admissions per capita fell substantially, with heart failure admissions per capita falling by 9.1 percent and pneumonia admissions falling 21.9 percent from 2010 to 2017. This suggests an increase in the share of heart failure and pneumonia patients who were treated on an outpatient basis. As less complex cases tend to be treated on an outpatient basis, the average severity of illness of those who were admitted may have increased. This hypothesis is supported by observed changes in characteristics of discharged beneficiaries from 2010 to 2017 that are not dependent on coding conventions. Specifically, we observed increasing shares of admitted patients who were discharged to hospice and discharged to SNFs. We observed a decreasing share of patients who were discharged to home without home healthcare. Average age of those admitted increased slightly. The exact share of the reduction in readmission and mortality that reflects improved outcomes and the share reflecting coding changes are difficult to discern. But the general trend is an improvement in rates of unplanned hospital readmissions.
Raw readmission rates declined then leveled off
Raw readmission rates declined by a statistically significant amount for all five HRRP conditions from 2010 to 2017 (Figure 1). However, most of this reduction occurred prior to 2014, and since that time raw readmission rates have been relatively stable. The reduction in readmission rates is statistically significant from 2010 to 2014 across all conditions, but is significant only for AMI, pneumonia, and hip and knee surgery after 2014. Heart failure readmission rates fluctuate in a narrow range between 2014 and 2017 (21.3 percent to 21.6 percent). We believe the flattening of readmission rates in part reflects the easiest improvements in care happening in earlier years, but also reflects increasing patient risk of readmission and mortality that may offset improvements in care, as we discuss below.
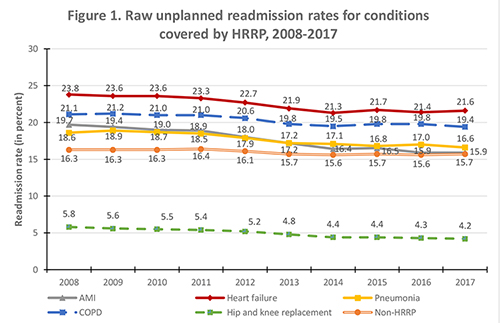
Note: AMI (acute myocardial infarction), COPD chronic obstructive pulmonary disease (COPD)), non-HRRP (conditions not covered by the Hospital Readmissions Reduction Program).
Source: MedPAC analysis of CMS claims data.
Risk-adjusted readmission rates generally declined
Risk-adjusted readmission rates continued to decline after 2014 (Figure 2). These declines were statistically significant. We discuss our risk adjustment methods in our June 2018 report to the Congress (Medicare Payment Advisory Commission 2018). A key question is how much of the declines are due to hospital coding and not a real change in patient severity of illness. Some research has suggested that coding increased when CMS introduced additional fields for coding in 2011 (Ody et al., 2019). It is also possible that providers coded more completely over time as they adjusted to new quality and cost incentives that are tied to coding. While we believe some of the observed increase in coded severity was due to hospitals’ coding changes, we believe that some of the changes in patient complexity are real. As the number of discharges per capita declined (see Figure 3), the remaining patients admitted to hospitals appear to be less healthy. This is reflected in the greater share of beneficiaries discharged to hospice, and SNF, with fewer discharges to home. For example, in 2010, 49.1 percent of heart failure patients were discharged home without home health care. By 2017, this dropped to 45.1 percent, with the share discharged to hospice increasing 1.4 percentage points, the share discharged to home health increasing 2.3 percentage points, and share discharged to SNF increasing 0.4 percentage points. The average age of heart failure patients was slightly older (80.5 years old in 2010 and 80.8 years old in 2017).

Note: AMI (acute myocardial infarction), COPD chronic obstructive pulmonary disease (COPD)), non-HRRP (conditions not covered by the Hospital Readmissions Reduction Program).
Source: MedPAC analysis of CMS claims data.
Admissions per capita fell dramatically
Admissions per capita declined between 2010 and 2017 for all conditions other than hip and knee replacement (Figure 3). It is plausible that the reduction in initial admissions may be due to the relatively healthier patients being treated on an outpatient basis, as discussed previously. Moreover, combined per capita readmissions to the hospital declined substantially for all conditions, due to fewer initial admissions and lower readmission rates for those who were admitted. For example, per capita initial admissions for heart failure fell from 18.0 per 1,000 beneficiaries to 16.4 per 1,000, a 9.1 percent decline. At the same time, risk-adjusted heart failure readmissions fell from 23.9 percent in 2010 to 20.5 percent in 2017, a 14.3 percent decline. The net effect is that per capita readmissions for heart failure declined from 4.2 per 1,000 beneficiaries in 2010 to 3.5 per 1000 in 2017, a 16.8 percent decline (data not shown).
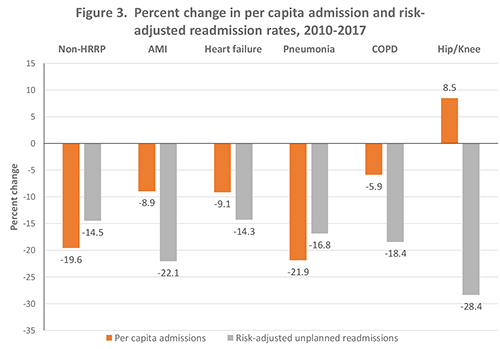
Note: AMI (acute myocardial infarction), COPD chronic obstructive pulmonary disease (COPD)), non-HRRP (conditions not covered by the Hospital Readmissions Reduction Program). As discussed below there was a coding change with respect to COPD and pneumonia in 2017. This resulted in a somewhat overstatement of the decline in pneumonia cases over time an somewhat understating the decline in COPD.
Source: MedPAC analysis of CMS claims data.
Mortality rates generally flat or declining, with the increase in mortality in 2017 for pneumonia and heart failure reflecting an artifact of a coding change
Some researchers have hypothesized that in an effort to reduce readmissions, hospitals may be avoiding admitting patients who truly need inpatient care, resulting in increasing mortality. Therefore, we examined trends in mortality concurrent with the HRRP. We found raw mortality rates have been relatively flat in recent years (Figure 4). Heart failure mortality increased slightly through 2015, but then declined back to 2011 levels by 2017. However, we observed an apparent increase in pneumonia and COPD mortality in 2017. This one-year increase in reported mortality is at least partially due to a shift in how hospitals were instructed to code COPD cases in an AHA Coding Clinic published in the third quarter of 2016 (Archibald 2017). The instructions essentially required hospitals to code cases with both an acute exacerbation of COPD and an acute lower respiratory infection as COPD, whereas previously these cases were classified based on which condition (COPD or pneumonia) was chiefly responsible for the admission. The result was that raw admission rates where COPD was the principal diagnosis increased by 71,000 from 2016 to 2017. At the same time, cases with pneumonia coded as principal diagnosis declined by 50,000 cases from 2016 to 2017. The instructions for coding COPD were revised again in at the end of 2017 to once again allow pneumonia to be the principal diagnosis when both the COPD and pneumonia diagnoses are present (Johnson 2017). To account for these coding changes, we combined pneumonia and COPD cases and looked at the change in mortality rates from 2016 to 2017. We found a small decrease in raw mortality rates (from 14.7 percent in 2010 to 14.0 percent in 2016 and 13.9 percent in 2017. What could cause this combination of increasing rates for individual conditions and a decline in combined rates? Because pneumonia has a relatively high mortality rate and COPD has a lower mortality rate, one possibility is that moving some of the lower-risk pneumonia cases to a COPD diagnosis could have resulted in an increase in both reported COPD mortality and reported pneumonia mortality in 2017. Because of changes in coding instructions, we believe the combined COPD and pneumonia mortality rates is a better indicator in changes in the quality of care from 2016 to 2017.

Note: COPD chronic obstructive pulmonary disease (COPD)), non-HRRP (conditions not covered by the Hospital Readmissions Reduction Program). AMI (acute myocardial infarction), mortality declined steadily, but was excluded to simplify the graphic.
Source: MedPAC analysis of CMS claims data.
Risk-adjusted mortality declined
Risk-adjusted mortality declined across all conditions we studied. All of the changes in risk-adjusted mortality are statistically significant. As we discussed earlier, some of this may be due to coding and some may be real improvement. Given that raw readmission and mortality rates were generally declining or flat, and we have broad evidence that patient severity was increasing at least to some degree, it appears that the overall quality of care as indicated by readmission and mortality was improving to some degree.

Note: AMI (acute myocardial infarction), COPD chronic obstructive pulmonary disease (COPD)), non-HRRP (conditions not covered by the Hospital Readmissions Reduction Program).
Source: MedPAC analysis of CMS claims data.
Redesigning the HRRP and other hospital quality incentive programs: Hospital value incentive program (HVIP)
Our updated analysis of hospital readmission rates and mortality is consistent with our earlier conclusions. The HRRP has been successful in reducing readmissions, without causing an adverse effect on beneficiary mortality. The magnitude of the improvement in readmissions and mortality is difficult to quantify. However, given the downward or flat raw readmission or mortality rates across most conditions and the indicators of increased severity of illness, it appears that that risk-adjusted readmission and mortality rates have improved since the introduction of the HRRP. But that does not mean that the policy cannot be improved. We have long stated that the magnitude of the readmission incentive is too large and we have discussed a broader and more balanced set of incentives.
In the March 2019 report to the Congress, the Commission recommended replacing the current hospital quality programs, including the HRRP, with a new hospital value incentive program (HVIP) that includes a small set of population-based outcome, patient experience, and value measures. We modeled the effects of an HVIP that includes five measure domains: readmissions, mortality, Medicare spending per beneficiary, patient experience, and hospital-acquired conditions. Unlike the HRRP, the HVIP scores hospitals based on the same absolute and prospectively set performance targets.
One of the net effects of the HVIP we modeled is that, compared to the current hospital quality payment programs, it levels the financial incentive to reduce readmissions so that it is equal with the incentives for mortality and patient experience.
The HVIP we modeled also uses all-condition measures of readmissions and mortality, instead of the condition-specific measures included in the current program. Using all-condition measures would increase the number of observations and reduce the random variation that single-condition readmission rates face under the current policy. The all-condition measures also affords more flexibility to hospitals to tailor interventions to the particular conditions more relevant to their patient population.
References
Archibald, L. 2017. Q&A: Coding guidelines for COPD and pneumonia. ACDIS blog. March 23. http://blogs.hcpro.com/acdis.
Johnson, L. M. 2017. COPD, sepsis among conditions creating coding dilemmas in new AHA coding clinic. https://protect2.fireeye.com/url?k=32dc0373-6e890a60-32dc324c-0cc47adb5650-cd10ec81192c90aa&u=https://www.icd10monitor.com/copd-sepsis-among-conditions-creating-coding-dilemmas-in-new-aha-coding-clinic.
Medicare Payment Advisory Commission. 2018. Report to the Congress: Medicare and the health care delivery system. Washington, DC: MedPAC.
Ody, C., L. Msall, L. S. Dafny, et al. 2019. Decreases in readmissions credited To Medicare’s program to reduce hospital readmissions have been overstated. Health Affairs 38, no. 1 (January): 36-43.
Sukul, D., G. J. Hoffman, U. Nuliyalu, et al. 2019. Association between Medicare policy reforms and changes in hospitalized Medicare beneficiaries’ severity of illness. JAMA Network Open 2, no. 5 (May 3): e193290.